


The Monthly NASDAQ 100 Chart is Concerning
The Monthly NASDAQ 100 Chart is Concerning
We don’t want to make anyone panic, but a good argument can be made for aggressively protecting tech stock holdings.

The Monthly NASDAQ 100 Chart is Concerning
We don’t want to make anyone panic, but a good argument can be made for aggressively protecting tech stock holdings. If my memory serves me correctly, we haven’t shared this monthly chart since late 2021 (when it was featured on the December 21st, 2021, episode of Mad Money). At the time, we were concerned about the unhealthy, steeply sloped rally. Since then, the NASDAQ 100 corrected from just under 17,000 to just over 10,000, later rallying back to make new all-time highs. However, those new highs are raising some red flags.
Despite the deep correction, the gains are still wildly outsized relative to historical bull market trajectories. The dotted black line represents a natural market slope on the provided monthly NASDAQ 100 futures market chart. It is easy to see that despite the digestion from late 2021 through the fall of 2023, the rally is still statistically ahead of schedule.
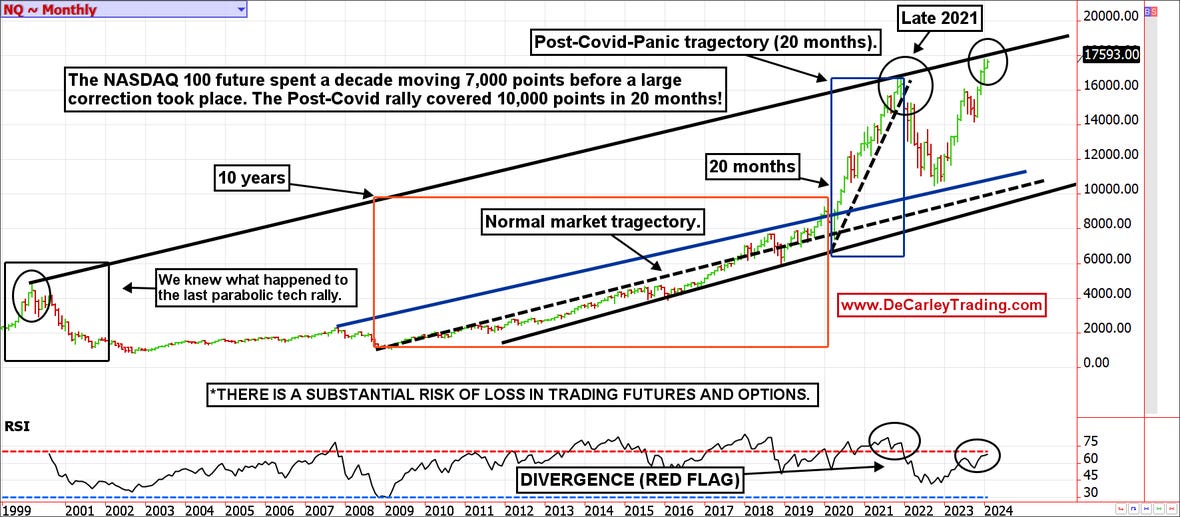
Also concerning is the divergence in the RSI (Relative Strength Index). In 2021, near the peak, the RSI on a monthly chart was reading 78.00. Today, with the NASDAQ 100 at a higher price, the RSI is still under 70.00. This type of disconnect between price and oscillator is often a red flag for trend exhaustion.
Lastly, we noticed that drawing a trendline from the dot.com bubble high through the 2021 high creates a trendline that could act as swift resistance at just under 18,000 (not far from recent highs). Is this trendline arbitrary? Maybe, but in my experience, simple lines drawn on a chart work far more often than they should.
If we wanted to believe the chart full stop, we could make an argument that the NASDAQ 100 could correct to under 12,000. We aren’t ready to “buy” into that theory just yet. Election years are generally good for markets, and the January barometer suggests 2024 is statistically set to be a positive one overall. Nevertheless, a correction seems imminent.
*There is substantial risk of loss in trading futures and options. There are no guarantees in speculation; most people lose money trading commodities. Past performance is not indicative of future results.
Seasonality is already factored into current prices, any references to such does not indicate future market action.
*There is substantial risk of loss in trading futures and options.** These recommendations are a solicitation for entering into derivatives transactions. All known news and events have already been factored into the price of the underlying derivatives discussed. From time to time persons affiliated with Zaner, or its associated companies, may have positions in recommended and other derivatives. Past performance is not indicative of future results. The information and data in this report were obtained from sources considered reliable. Their accuracy or completeness is not guaranteed. Any decision to purchase or sell as a result of the opinions expressed in this report will be the full responsibility of the person authorizing such transaction. Seasonal tendencies are a composite of some of the more consistent commodity futures seasonals that have occurred over the past 15 or more years. There are usually underlying, fundamental circumstances that occur annually that tend to cause the futures markets to react in similar directional manner during a certain calendar year. While seasonal trends may potentially impact supply and demand in certain commodities, seasonal aspects of supply and demand have been factored into futures & options market pricing. Even if a seasonal tendency occurs in the future, it may not result in a profitable transaction as fees and the timing of the entry and liquidation may impact on the results. No representation is being made that any account has in the past, or will in the future, achieve profits using these recommendations. No representation is being made that price patterns will recur in the future.