


The DeCarley Perspective...The Smart Money might finally put their Money where their Mouths are in Crude Oil
We monitor commodity market positioning and sentiment almost as much as we chart prices.

The Smart Money might finally put their Money where their Mouths are in Crude Oil.
We monitor commodity market positioning and sentiment almost as much as we chart prices. We’ve witnessed an unusual conundrum; the spread between the market sentiment of industry insiders and the net long futures market position held in crude oil is unsustainably wide. Specifically, according to the Bullish Consensus Sentiment Index, about 70% of those polled are bullish crude oil. Nonetheless, the COT (Commitments of Traders) Report issued by the CFTC (Commodity Futures Trading Commission) suggests that a mere 250,000 net long contracts are currently being held. This is substantially below the half-a-million contracts held last year and, even more so, below the 750,000 all-time high net long position. If the so-called “smart money” decided to put their money where their mouths are, oil could see $92.00 per barrel, at minimum, and possibly even reach the low triple digits!
Seasonally, the oil market has a tendency to peak in mid-to-late October, so that leaves multiple weeks of seasonal support. Further, we are still burning off the fumes of the 2020 COVID stimulus and liquidity injection campaigns; higher fuel prices haven’t hurt the travel industry. I’ve been traveling for work and pleasure; I can attest flying in 2023 is not the same as in 2019. Lost luggage, delayed flights, canceled flights, and other inconveniences are expected obstacles, not outliers, yet there are butts in seats. In fact, TSA data reports record traffic!
Monthly Crude Oil Futures
Revisiting the monthly oil chart, it is clear that prices held an uptrend line that dates back to the 2016 low (COVID shutdowns and an OPEC+ price war temporarily and violently breached this trendline). We see a similar downtrend line that dates back to 2010 (the Russian invasion of Ukraine temporarily and violently breached this trendline); this line comes in near $101.00 and will likely act as a price magnet. Confirming this idea is an RSI (Relative Strength Index) oscillator pointing higher with plenty of room to run before the market could be considered overbought.

Weekly Crude Oil Futures
Like the monthly chart, the weekly chart of oil futures suggests a move to $101.00 is in play. Weakness earlier this year found support near the 200-day moving average and pushed prices into what we believe is an equilibrium range between $75.00 and $101.00. According to our charts, this is the natural price range that likely would have existed if the black swan events from 2020 through 2022 were removed.
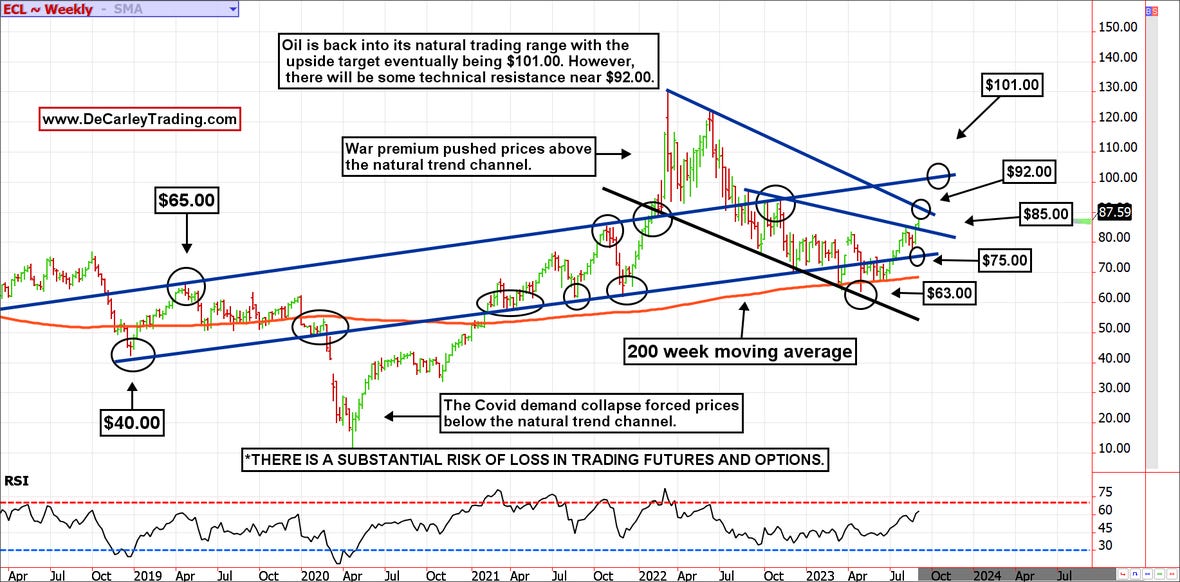
We suspect some rough waters near $92.00 based on a sharp downtrend line stemming from the 2022 top. Still, if the pessimism over China’s economic data dissipates and interest rates stabilize, triple-digit crude oil is likely (in our humble opinion).
*There is substantial risk of loss in trading futures and options. There are no guarantees in speculation; most people lose money trading commodities. Past performance is not indicative of future results.
Seasonality is already factored into current prices, any references to such does not indicate future market action.
**There is substantial risk of loss in trading futures and options.** These recommendations are a solicitation for entering into derivatives transactions. All known news and events have already been factored into the price of the underlying derivatives discussed. From time to time persons affiliated with Zaner, or its associated companies, may have positions in recommended and other derivatives. Past performance is not indicative of future results. The information and data in this report were obtained from sources considered reliable. Their accuracy or completeness is not guaranteed. Any decision to purchase or sell as a result of the opinions expressed in this report will be the full responsibility of the person authorizing such transaction. Seasonal tendencies are a composite of some of the more consistent commodity futures seasonals that have occurred over the past 15 or more years. There are usually underlying, fundamental circumstances that occur annually that tend to cause the futures markets to react in similar directional manner during a certain calendar year. While seasonal trends may potentially impact supply and demand in certain commodities, seasonal aspects of supply and demand have been factored into futures & options market pricing. Even if a seasonal tendency occurs in the future, it may not result in a profitable transaction as fees and the timing of the entry and liquidation may impact on the results. No representation is being made that any account has in the past, or will in the future, achieve profits using these recommendations. No representation is being made that price patterns will recur in the future.